

Top 15 US States with the Highest Percentage of Illegal Immigrants
In this exploration, we’re going to delve into the 15 states that have the highest proportion of undocumented immigrants. If you’re eager to get straight to the facts, feel free to jump ahead to the section titled ‘5 States with the Highest Percentage of Undocumented Immigrants.’
The Center for Immigration Studies provides a clear definition for our study, describing undocumented immigrants as “foreign-born noncitizens who are not legal residents.”
With this understanding and in accordance with the 14th Amendment of the United States, we’ve decided to leave out US-born children of undocumented immigrants from our investigation.
The terms ‘undocumented immigrants’ and ‘illegal immigrants’ are often used interchangeably, but they carry different connotations. Those who are less supportive of legalizing the status of these individuals tend to use ‘illegal immigrants’, while those who are more sympathetic use ‘undocumented immigrants’.
Undocumented Woman
This linguistic divide mirrors the broader polarization in American political leadership over US immigration policy. This societal and political divide in the US regarding the status of undocumented immigrants appears to have impacted their population.
Interestingly, there’s been a decrease in the undocumented immigrant population in the United States from 2011 to 2019. The Republican party holds the view that the US economy incurs significant costs due to undocumented immigrants.
As we move forward in this article, we’ll delve into the economic implications of undocumented immigration in the United States. So, let’s embark on this journey of discovery together, as we unravel the complexities of immigration in the United States.
The Economic Impact of Undocumented Immigration in the United States
On January 27, 2019, former President Donald Trump sparked a conversation with a tweet claiming that the cost of undocumented immigration for that year had already reached $18,959,495,168. While this figure may seem inflated, it does prompt us to consider the economic implications of undocumented immigration in the United States.
This is a particularly pertinent question for those considering residing in states with a high percentage of undocumented immigrants, as it can influence the labor market dynamics. Quantifying the exact economic impact of undocumented immigration is a complex task.
Nevertheless, various independent nongovernmental organizations frequently conduct studies to estimate these costs. One such organization, the Federation for American Immigration Reform (FAIR) – a nonprofit with an anti-immigration stance, recently estimated the cost of undocumented immigration at $150.7 billion.
Their study suggests that the total federal expenditure on undocumented immigrants is $66.4 billion, a figure that has reportedly increased by 45 percent since 2017. The study also posits that undocumented immigrants contribute approximately $31 billion in taxes.
Contrary to these somewhat alarming figures, organizations advocating for undocumented immigrants argue that granting them citizenship could stimulate US economic growth. The Center for American Progress (CAP), a public policy research and advocacy organization, conducted a study assessing the potential economic impact of legalizing undocumented immigrants.
Their findings suggest that granting citizenship to all undocumented immigrants could boost the US GDP by $1.7 trillion over a decade and create 438,800 new jobs within the same timeframe. The question of whether pathways to legal citizenship for undocumented immigrants will be established remains unanswered.
However, it is evident that their presence is significant, particularly in states like California, which has the highest percentage of undocumented immigrants. It’s also clear that the majority of undocumented immigrants are confined to precarious job opportunities, a reality that further complicates this multifaceted issue.
Demographic Breakdown: Profile of Undocumented Immigrants in the U.S.
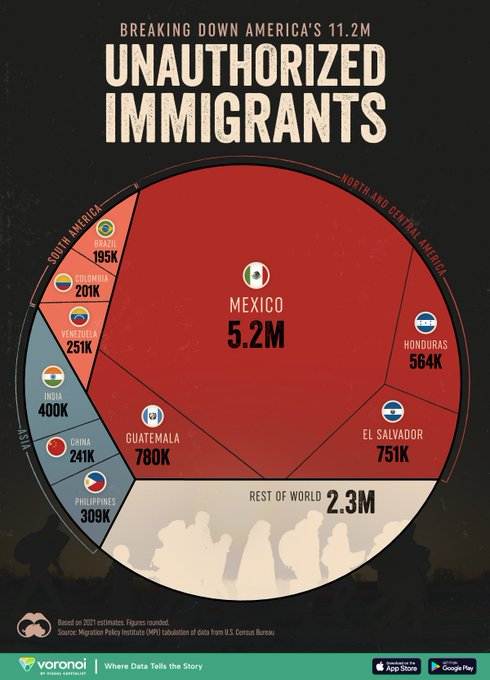
Historically, Mexican nationals have made up the majority of undocumented immigrants in the United States. However, this trend has been shifting, with their representation falling to less than half of the total undocumented population by 2017.
So, what does the current demographic landscape of undocumented immigrants in the United States look like? According to estimates from the Migration Policy Institute in 2019, the total undocumented population in the United States was around 11 million.
Mexicans still made up the largest share, accounting for 48 percent of this population. However, migrants from El Salvador and Guatemala were not far behind, each contributing 7 percent to the total undocumented population.
Interestingly, Indians made up 5 percent of the total undocumented immigrant population in the United States in 2019. In terms of age distribution, the largest segment of this population fell within the 35-44 age group, representing about 28 percent.
The smallest segment was those aged 16 and under, making up about 5 percent of the total. Women constituted 46 percent of the undocumented immigrant population. When we look at the employment sector, the highest proportion of undocumented immigrants (21 percent) worked in the construction industry. Meanwhile, 16 percent were employed in accommodation and food services, arts, entertainment, and recreation.
Notably, only 4 percent of undocumented immigrants participating in the labor force were unemployed. However, despite a high employment rate among this group, 43 percent of undocumented immigrants lived below 200% of the poverty level, highlighting the economic challenges this population often faces.The State with the Highest Number of Undocumented Immigrants: California
California tops the list when it comes to the number of undocumented immigrants. Our research indicates that almost 3 million undocumented immigrants reside in California.
This population has a significant influence on the state’s labor market, as they constitute one in every ten workers in California.
The State with the Lowest Number of Undocumented Immigrants: West Virginia
On the other end of the spectrum, West Virginia has the smallest number of undocumented immigrants. Our estimates suggest that around 5,000 undocumented immigrants live in West Virginia, accounting for just 0.28% of the state’s total population.
It’s also noteworthy that undocumented immigrants make up less than 14% of the total immigrant population in West Virginia. Now, let’s move on to the list of states with the highest percentage of undocumented immigrants.
More states extend health coverage to immigrants even as issue inflames GOP

Immigrants wait to be processed after they crossed the border into the U.S. in Eagle Pass, Texas, on Dec. 22. Eleven states and D.C. offer taxpayer-funded health insurance to some immigrants without legal status. Chandan Khanna/AFP via Getty Images
Yearly Health Care for Undocumented Immigrants – Search
A growing number of states are opening taxpayer-funded health insurance programs to immigrants, including those living in the U.S. without authorization, even as Republicans assail President Joe Biden over a dramatic increase in illegal crossings of the southern border.
Eleven states and Washington, D.C., together provide full health insurance coverage to more than 1 million low-income immigrants regardless of their legal status, according to state data compiled by KFF Health News. Most aren’t authorized to live in the U.S., state officials say.
Enrollment in these programs could nearly double by 2025 as at least seven states initiate or expand coverage. In January, Republican-controlled Utah will start covering children regardless of immigration status, while New York and California will widen eligibility to cover more adults.
“These are kids, and we have a heart,” said Utah state Rep. Jim Dunnigan, a Republican who initially opposed his state’s plan to cover children lacking legal status but relented after compromises including a cap on enrollment.
There are more than 10 million people living in the U.S. without authorization, according to estimates by the Pew Research Center. Immigrant advocates and academic experts point to two factors behind state leaders’ rising interest in providing health care to this population: The pandemic highlighted the importance of insurance coverage to control the spread of infectious diseases; and some states are focusing on people without legal status to further drive down the country’s record-low uninsured rate.
States have also expanded coverage in response to pleas from hospitals, lawmakers say, to reduce the financial burden of treating uninsured patients.
All states pay hospitals to provide emergency services to some unauthorized residents in emergency rooms, a program known as Emergency Medicaid. About a dozen states have extended coverage for only prenatal care for such people. Full state-provided health insurance coverage is much less common, but increasing.
An estimated half of the people living in the U.S. without authorization are uninsured, according to a KFF-Los Angeles Times survey. That’s more than five times the uninsured rate for U.S. citizens. Immigrants lacking authorization are ineligible for federal health programs. But states can use their own money to provide coverage through Medicaid, the state-federal insurance program for low-income people.
Methodology
In order to rank the 15 states with the highest percentage of undocumented immigrants, we utilized the most recent estimates available. Our estimation of the undocumented population in each state was derived from two primary sources.
The first was the 2021 state-by-state estimates of undocumented immigrants provided by the Federation for American Immigration Reform, a non-governmental organization. The second source was the 2019 state-by-state estimates of unauthorized immigrants from the Migration Policy Institute, a renowned institution specializing in migration policy.
We calculated our final estimates by taking the average of these two data sources
WHICH SIDE WOULD WIN THE CIVIL WAR
21 hours ago · A definitive, certified AP count released on January 6, 2025, shows
Trump at 77,303,573 and Harris at 75,019,257, a gap of 2,284,316 votes.
City Dwellers versus Rural Population in The United States
The urban population in the United States has grown by 6.4% between 2010 and 2020, while the rural population has increased from 19.3% in 2010 to 20.0% in 2020. This shift is largely due to changes in the criteria for defining urban areas, which now account for 80.0% of the U.S. population. Urban areas are defined as densely developed residential, commercial, and other nonresidential areas, with a minimum population threshold increased from 2,500 to 5,000. Despite the urban population increase, urban areas have become denser, changing from an average population density of 2,343 in 2010 to 2,553 in 2020.
Census.gov
The rural population, which includes those in areas outside of urban classifications, has seen a decline in percentage of the national population from 19.3% in 2010 to 20.0% in 2020. This change is not indicative of substantial urban to rural migration but rather a result of the new criteria for urban area classification.
Census.gov
The 2020 Census data also revealed that 1,140 areas classified as urban in 2010 are now considered rural, and 36 new urban areas were classified as rural in 2010. Census.gov
Number of Unauthorized (Illegal) Immigrants By US State – Brilliant Maps
Top 15 US States with the Highest Percentage of Illegal Immigrants
13 Popular Beliefs People Mistakenly Think Are in the Bible
| California | 1 | 39,663,800 | 0.59% | 0.07% | 255 | |
| Texas | 2 | 31,853,800 | 1.8% | 1.79% | 122 | |
| Florida | 3 | 23,839,600 | 2% | 2.08% | 445 | |
| New York | 4 | 19,997,100 | 0.65% | -0.11% | 424 | |
| Pennsylvania | 5 | 13,139,800 | 0.47% | 0.22% | 294 | |
| Illinois | 6 | 12,778,100 | 0.53% | -0.03% | 230 | |
| Ohio | 7 | 11,942,600 | 0.5% | 0.24% | 292 | |
| Georgia | 8 | 11,297,300 | 1.04% | 1.05% | 196 | |
| North Carolina | 9 | 11,210,900 | 1.49% | 1.46% | 231 | |
| Michigan | 10 | 10,197,600 | 0.56% | 0.25% | 180 | |
| New Jersey | 11 | 9,622,060 | 1.28% | 0.75% | 1,308 | |
| Virginia | 12 | 8,887,700 | 0.87% | 0.58% | 225 | |
| Washington | 13 | 8,059,040 | 1.27% | 0.86% | 121 | |
| Arizona | 14 | 7,691,740 | 1.44% | 1.4% | 68 | |
| Tennessee | 15 | 7,307,200 | 1.1% | 1.09% | 177 | |
| Massachusetts | 16 | 7,205,770 | 0.97% | 0.6% | 924 | |
| Indiana | 17 | 6,968,420 | 0.64% | 0.52% | 195 | |
| Maryland | 18 | 6,309,380 | 0.74% | 0.43% | 650 | |
| Missouri | 19 | 6,282,890 | 0.6% | 0.42% | 91 | |
| Colorado | 20 | 6,013,650 | 0.94% | 0.78% | 58 | |
| Wisconsin | 21 | 5,991,540 | 0.51% | 0.32% | 111 | |
| Minnesota | 22 | 5,833,250 | 0.69% | 0.43% | 73 | |
| South Carolina | 23 | 5,569,830 | 1.66% | 1.7% | 185 | |
| Alabama | 24 | 5,197,720 | 0.78% | 0.65% | 103 | |
| Kentucky | 25 | 4,626,150 | 0.82% | 0.52% | 117 | |
| Louisiana | 26 | 4,607,410 | 0.21% | -0.19% | 107 | |
| Oregon | 27 | 4,291,090 | 0.44% | 0.22% | 45 | |
| Oklahoma | 28 | 4,126,900 | 0.77% | 0.81% | 60 | |
| Connecticut | 29 | 3,707,120 | 0.87% | 0.71% | 766 | |
| Utah | 30 | 3,564,000 | 1.72% | 1.7% | 43 | |
| Nevada | 31 | 3,320,570 | 1.63% | 1.31% | 30 | |
| Iowa | 32 | 3,264,560 | 0.71% | 0.46% | 58 | |
| Arkansas | 33 | 3,107,240 | 0.61% | 0.61% | 60 | |
| Kansas | 34 | 2,989,710 | 0.64% | 0.35% | 37 | |
| Mississippi | 35 | 2,942,920 | 0% | -0.11% | 63 | |
| New Mexico | 36 | 2,139,350 | 0.43% | 0.2% | 18 | |
| Idaho | 37 | 2,032,120 | 1.52% | 1.98% | 25 | |
| Nebraska | 38 | 2,023,070 | 0.88% | 0.61% | 26 | |
| West Virginia | 39 | 1,769,460 | -0.03% | -0.25% | 74 | |
| Hawaii | 40 | 1,450,900 | 0.33% | -0.01% | 226 | |
| New Hampshire | 41 | 1,415,860 | 0.48% | 0.54% | 158 | |
| Maine | 42 | 1,410,380 | 0.38% | 0.67% | 46 | |
| Montana | 43 | 1,143,160 | 0.52% | 1.03% | 8 | |
| Rhode Island | 44 | 1,121,190 | 0.8% | 0.45% | 1,084 | |
| Delaware | 45 | 1,067,410 | 1.47% | 1.52% | 548 | |
| South Dakota | 46 | 931,033 | 0.69% | 0.97% | 12 | |
| North Dakota | 47 | 804,089 | 0.94% | 0.63% | 12 | |
| Alaska | 48 | 743,756 | 0.49% | 0.29% | 1 | |
| Vermont | 49 | 648,278 | -0.03% | 0.17% | 70 | |
| Wyoming | 50 | 590,169 | 0.43% | 0.43% | 6 |
The Most Unbelievable Story in Sports: The Story 0f Yasiel Puig