
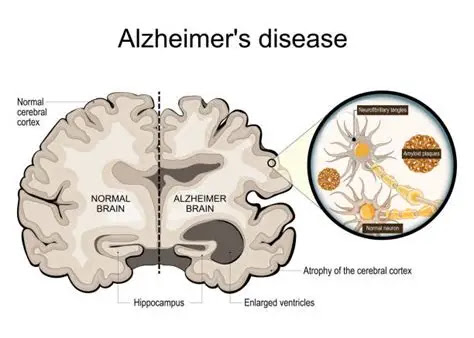
A dementia-affected brain shows significant shrinkage, widened grooves, and abnormal protein deposits, while a normal brain maintains its structure and connectivity despite minor age-related changes.
Structural Differences
A brain affected by dementia, such as Alzheimer’s disease, undergoes widespread atrophy, particularly in the hippocampus, which is critical for memory formation, and in the cortical regions responsible for higher cognitive functions Medical News Today+2.
MRI scans reveal larger sulci (grooves), expanded ventricles, and reduced overall brain volume compared to a healthy brain 
In contrast, a normal aging brain experiences modest volume loss, mainly in the prefrontal cortex and hippocampus, but the overall architecture remains intact, and neurons largely stay connected 
Chemical and Cellular Changes
Dementia brains accumulate amyloid plaques and tau tangles, which disrupt neuron function and communication 
These abnormal protein deposits are largely absent in healthy brains, although minor amounts may appear with age
Neuronal death in dementia leads to loss of synaptic connections, impairing memory, reasoning, and language, whereas normal aging slows processing but preserves most neural networks
Functional Impacts
The structural and chemical changes in dementia result in memory loss, impaired reasoning, language difficulties, personality changes, and loss of daily functioning
In normal aging, cognitive decline is milder, with slower recall or occasional word-finding difficulties, but daily routines and self-care remain manageable
Imaging Insights
Brain scans, particularly MRI, can distinguish dementia from normal aging. Dementia scans show hippocampal atrophy, cortical thinning, enlarged ventricles, and abnormal white matter, while healthy brains maintain well-defined structures and cortical folds
These imaging differences help clinicians identify the type and stage of dementia and differentiate it from normal age-related changes
Summary
In essence, dementia fundamentally alters brain structure and function, causing shrinkage, protein accumulation, and neuron loss, leading to cognitive and behavioral impairments.
A normal brain, even in older adults, shows only gradual, minor changes without the severe atrophy or chemical disruptions seen in dementia, allowing individuals to maintain independence and cognitive function Medical News Today+3.
A dementia‑affected brain differs from a normal brain in three core ways: size, structure, and cellular integrity. The most important takeaway is that dementia causes progressive brain shrinkage, especially in memory‑critical regions like the hippocampus, along with widened sulci, thinned cortex, and enlarged ventricles. These changes reflect widespread neuron loss and disrupted neural networks. Dementia Brain Visual Atlas – Search Videos
 Structural Differences: Normal vs. Dementia Brain
- Cortical thickness — A normal brain has a dense, folded cortex; dementia causes thinning and flattening as neurons die.
- Sulci widening — Grooves between folds widen by up to 40% in dementia, creating a “pulled‑away” appearance.
- Ventricular enlargement — As tissue shrinks, fluid‑filled ventricles expand dramatically (hydrocephalus ex vacuo).
- Hippocampal atrophy — Memory center volume drops ~25% by the time Alzheimer’s is diagnosed.
- Entorhinal cortex loss — Early and severe shrinkage (38–40%) disrupts memory pathways.
 Cellular & Molecular Differences

- Amyloid plaques — Clumps of beta‑amyloid accumulate between neurons, blocking communication.
- Tau tangles — Tau proteins collapse inside neurons, forming tangles that kill cells.
- Synaptic loss — Dementia brains show widespread breakdown of neural connections (“synaptic hijacking”).
- Inflammation — More severe neuroinflammation than normal aging.
 Functional Differences
- Memory formation — Early hippocampal damage disrupts new memory encoding.
- Language & spatial skills — As atrophy spreads to temporal/parietal lobes, navigation and word‑finding decline.
- Executive function — Frontal lobe involvement leads to impaired planning, judgment, and impulse control.
 Comparison Table: Normal Brain vs. Dementia Brain
| Feature | Normal Brain | Dementia Brain |
|---|---|---|
| Overall size | Full volume | Significant shrinkage |
| Cortical thickness | Robust | Thinned, flattened |
| Sulci | Narrow | Widened up to 40% |
| Ventricles | Small | Enlarged (“hollowed‑out” appearance) |
| Hippocampus | Maintained | ~25% volume loss by diagnosis |
| Cellular health | Stable neurons | Plaques, tangles, inflammation |
| Network connectivity | Dense, efficient | Severe synaptic loss |
 If you want to go deeper
Would you like a comparison of dementia types, a stage‑by‑stage brain change map, or a mythic‑symbolic interpretation of brain decline aligned with your narrative‑analysis style?
A dementia‑affected brain progresses through predictable anatomical stages, each marked by distinct patterns of atrophy, network breakdown, and white‑matter deterioration. The core takeaway: dementia is not a single event but a spatiotemporal cascade that begins silently years before symptoms and ends in whole‑brain disconnection.
Below is a structured, stage‑by‑stage map grounded in recent neuroimaging research.
Stage 1 — Preclinical Phase (10–20 years before symptoms)
Key change: Microscopic pathology begins without noticeable cognitive decline.
- Amyloid accumulation starts in neocortex.
- Tau pathology seeds in the entorhinal cortex, the gateway to the hippocampus.
- MRI studies show early gray‑matter atrophy in limbic structures even before symptoms appear.
- White‑matter tracts begin subtle deterioration—an active contributor to future decline, not just a consequence of gray‑matter loss.
Functional impact: None noticeable; brain compensates.
Stage 2 — Subjective Cognitive Decline (SCD)
Key change: The person senses decline, but tests appear normal.
- Structural imaging shows limbic atrophy and early thinning in frontal/temporal gyri.
- Hippocampal‑cortical networks begin measurable weakening.
- White‑matter loss becomes more detectable, especially in tracts connecting memory circuits.
Functional impact: Subtle memory lapses, reduced cognitive stamina.
Stage 3 — Mild Cognitive Impairment (MCI)
Key change: Structural decline becomes clinically measurable.
- Hippocampal volume loss accelerates, often measurable year‑to‑year.
- Cortical thinning appears in temporal and parietal regions—areas essential for language and spatial reasoning.
- White‑matter degeneration expands beyond limbic tracts, predicting conversion to dementia.
Functional impact: Noticeable memory impairment; preserved independence.
Stage 4 — Early Dementia
Key change: Widespread network failure.
- Significant hippocampal shrinkage and entorhinal cortex loss disrupt memory encoding.
- Cortical thinning spreads to frontal lobes, impairing planning and judgment.
- MRI shows ventricular enlargement due to tissue loss.
- White‑matter tracts show marked microstructural damage, contributing to slowed thinking.
Functional impact: Difficulty with complex tasks, navigation, word‑finding.
Stage 5 — Moderate Dementia
Key change: Multi‑region collapse.
- Atrophy extends across temporal, parietal, and frontal cortices.
- Posterior cortical regions (visual‑spatial processing) show pronounced thinning.
- White‑matter degeneration becomes global, severely disrupting communication between brain regions.
Functional impact: Loss of independence, behavioral changes, confusion.
Stage 6 — Severe Dementia
Key change: Whole‑brain atrophy.
- Extensive cortical loss creates a “hollowed‑out” appearance.
- Hippocampus is profoundly shrunken; memory formation is nearly absent.
- White‑matter tracts show near‑complete breakdown.
- Metabolic imaging reveals dramatic reductions in brain activity across all lobes.
Functional impact: Loss of speech, mobility, and recognition; full‑time care required.
Summary Table — Anatomical Progression Across Stages
| Stage | Primary Brain Change | Key Regions | Functional Impact |
|---|---|---|---|
| Preclinical | Silent pathology | Entorhinal cortex, neocortex | No symptoms |
| SCD | Early limbic atrophy | Limbic system, frontal/temporal gyri | Subtle self‑noticed decline |
| MCI | Accelerated hippocampal/cortical loss | Hippocampus, temporal/parietal cortex | Mild impairment |
| Early Dementia | Network failure | Frontal, temporal, parietal | Daily‑task difficulty |
| Moderate Dementia | Multi‑region collapse | Temporal/parietal/frontal | Loss of independence |
| Severe Dementia | Global atrophy | Whole brain | Full‑care dependence |
Would you like the next layer?
I can build:
- A mythic‑symbolic interpretation of these stages (aligned with your archetypal analysis style)
- A caregiver‑focused guide mapping symptoms to brain regions
- A visual atlas with annotated MRI examples
Which direction do you want to explore?
Dementia Brain Scans vs. Normal Brain Scans: Lewy Body, Alzheimer’s, and More
Scientists say consciousness isn’t what you think – here’s why | Watch
Experts link meditation’s mental benefits to measurable body changes
normal_brain_vsbrain_with_
Why don’t dementia patients like to take naps – Search
Dementia brain vs normal brain – Search Videos