
The American Lung Association has an annual report out anually on the troubling state of US air quality. While you might think of smog-shrouded cities as the biggest offenders when it comes to air pollution, in the United States the most dangerous air to breathe is actually found far outside of its biggest metropolises. Which is actually far more troubling.
The type of air pollution that is most damaging to humans is caused by “fine particulate matter,” where particles from smoke or soot less than 2.5 micrometers in diameter are present in high numbers (you’ll see this referred to as PM 2.5).
This is the same kind of air pollution that kills about 5.5 million people globally every year. In the 17 years that the American Lung Association has been putting together this report, long-term particle pollution has generally gone down across the country. Ozone, another pollutant the report measures, has also gone dramatically down, mostly due to more fuel-efficient vehicles.
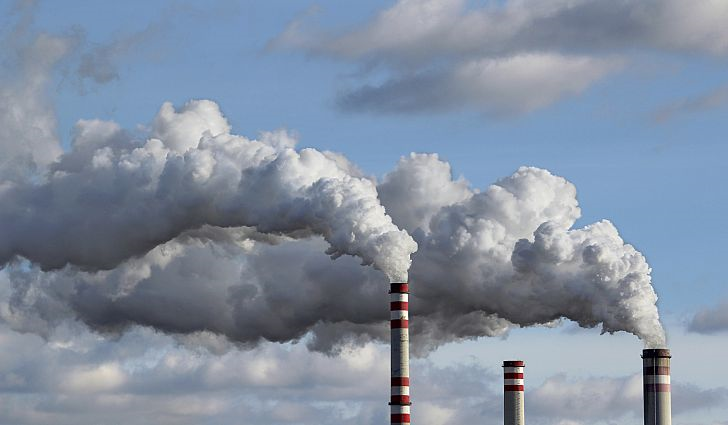
But there’s a very disturbing anomaly. Since 2015, there have been more short-term spikes in particle pollution—in fact, seven of the 25 most polluted cities had their highest number of unhealthy short-term particle pollution days on average ever reported. These can be caused by the processing and burning of fossil fuels, like coal-fired power plants and diesel vehicles.
But these spikes are exacerbated by and directly correlated to climate change-related events like extreme heat, drought, and wildfires. So it’s no surprise that most of the cities seeing the worst spikes in particle pollution are in California, which has experienced heavy doses of all three of these things.
Geo-Engineering: The chemtrail conspiracy theory is the false claim that long-lasting condensation trails, called “chemtrails” by proponents, consist of chemical or biological agents left in the sky by high-flying aircraft and also deliberately sprayed for purposes undisclosed to the general public. Believers in the theory argue that normal contrails dissipate relatively quickly and contrails that do not dissipate must contain additional substances which might be changing our weather patterns!!!
Air pollution in America
How clean is the air you breathe? For the past 19 years, the American Lung Association has released an annual “State of the Air” report, using data from official air quality monitors to look at pollution levels in cities across the U.S.
Over 133.9 million Americans now live in counties with unhealthy levels of air pollution, the organization says — more than two of every five people. That’s up from 125 million people in the 2017 report. Not to mention the rising arsenic levels caused by the oil spills in the Gulf of Mexico
The American Lung Association evaluated cities for three types of air pollution: ozone (often called “smog”), year-round particle pollution, and short-term particle pollution. Particle pollution refers to the small liquid and solid particles that come from burning fossil fuel and other sources, small enough to float in the air and get inhaled into the lungs.
The health risks include lung cancer, asthma attacks, and developmental problems among children, among other issues.
Here’s a look at the 16 communities with the highest year-round particulate levels — some of the places where air pollution could pose the greatest risk to your health.
#15 (tie): Houston-The Woodlands, TX
Houston tied 15th highest year-round particle pollution out of 187 metro areas included in the report. It also ranked 11th out 227 cities for high ozone days.
#15 (tie): Harrisburg-York-Lebanon, PA
This metro area tied for 15th highest annual particle pollution levels. It ranked 22nd for 24-hour particle pollution.
In addition to fossil fuels, “burning firewood and trash are among the major sources of particle pollution (soot) in many parts of the country,” the report notes.
#15 (tie): Birmingham-Hoover-Talladega, AL
The Birmingham metro area tied for 15th highest annual particle pollution levels. But it was #1 on the list of cleanest metro areas in 24-hour particle pollution.
#14: Detroit-Warren-Ann Arbor, MI
Motor City and its neighbors ranked 14th out of 187 metro areas for annual particle pollution levels, but scored somewhat better when it comes to high ozone days: 40th out of 227.
#13: Indianapolis-Carmel-Muncie, IN
The Indianapolis-Carmel-Muncie metro area of Indiana had high year-round levels of particle pollution, ranking 13th out of 187. Studies have shown that chronic exposure to particle pollution can shorten life by one to three years.
#12: Philadelphia-Reading-Camden, PA-NJ-DE-MD
The metropolitan area encompassing Philadelphia ranked 12th out of 187 in the country for year-round particle pollution. It was also 24nd out of 227 cities for its high ozone levels.
“The burden of air pollution is not evenly shared. Poorer people and some racial and ethnic groups are among those who often face higher exposure to pollutants,” the report says.
#10 (tie): San Jose-San Francisco-Oakland, CA
The San Jose-San Francisco-Oakland metropolitan area tied for 10th out of 187 cities for annual particle pollution, and was 6th out of 201 cities for 24-hour particle pollution. It ranked 13th for high ozone levels.
#10 (tie): Cleveland-Akron-Canton, OH
This area was number 10 out of 187 metropolitan areas for yearly particle pollution but scored much better — No. 68 — for 24-hour particle pollution. It ranked 30th for high ozone.
#8 (tie): Pittsburgh-New Castle-Weirton, PA-OH-WV
This region was 8th out of 187 metropolitan areas for annual particle pollution. It ranked 10th for 24-hour particle pollution and 32nd for high ozone days.
#8 (tie): Lancaster, PA
Lancaster ranked 8th for annual particle pollution out of 187 metropolitan areas. But its ozone levels were better, placing the community at No. 62 out of 227 metro areas in the rankings.
#7: El Centro, CA
El Centro, near the Southern California border, ranked 7th out of 187 cities for yearly particle pollution. It ranked high in the other categories as well — 9th for 24-hour particle pollution and 15th for high ozone days.
The health risks of air pollution can be especially worrisome for children, the report notes, “because their lungs are growing and because they are so active.”
#6: Modesto-Merced, CA
The Modesto-Merced area in California’s Central Valley had poor air quality by all measures in the American Lung Association report. It ranked 6th for annual particle pollution, 5th for 24-hour particle pollution and 7th for high ozone days.
#5: Fresno-Madera, CA
The Fresno-Madera metro area in California ranked 5th out of 187 metropolitan areas for yearly particle pollution. It also ranked very high in the other categories, coming in 3rd for 24-hour particle pollution and 4rd for high ozone days.
#4: Los Angeles-Long Beach, CA
Notorious for its smog, the Los Angeles-Long Beach, California, area has seen air quality improve in recent years, but it still placed 4th for annual particle pollution and 7th for 24-hour particle pollution.
L.A. ranked worst out of 227 metropolitan areas for high ozone days.
To protect yourself, the American Lung Association advises avoiding outdoor exercise when air pollution levels are high, and avoiding exercise near high-traffic areas.
#3: Bakersfield, CA
Bakersfield has some unhealthy air. Beyond being ranked third for yearly particle pollution, it ranked worst for 24-hour particle pollution and 2nd for high ozone days.
#2: Visalia-Porterville-Hanford, CA
Coming in second on the list was the Visalia-Porterville-Hanford metro area in California’s San Joaquin Valley. It’s a bit of an improvement over 2017’s #1 worst ranking. It ranked 2nd for 24-hour particle pollution and 3rd for high ozone days.
#1: Fairbanks, AK
This city in central Alaska ranked worst for annual particle pollution levels for the first time, due to the burning of wood and other solid fuels to heat homes during the long winter.
But on the bright side, it also tied for first place on the list of cleanest cities when it comes to ozone pollution.
A few of the top cities that have the most dangerous air —Bakersfield, Fresno, Visalia, and Modesto—are all located in California’s Central Valley. These are not big cities, nor are they necessarily large industrial centers. These are agricultural regions. Farming is actually a huge source of pollution, thanks to emissions from fertilizers and animal waste.
And because of the geography of the Central Valley, it ends up catching and trapping everything else that drifts over from those larger cities, including the emissions from power plants and vehicles. The increased oil and gas production in the Central Valley isn’t making things any better.
What’s messed up is that these cities—housed in some of the lowest-income counties in the state—are now shouldering both the economic and environmental burden for the rest of the country. The drought has been hard enough on those who are working to grow our food. Now the people who live there are being subjected to poisoned air and shortened lives thanks to the country’s fossil fuel addiction.
 Ohio is the most polluted state.
Curbing carbon emission has been an issue for many countries around the globe. Climate change fueled by global warming has brought about a sense of urgency among world leaders to reduce carbon footprints and focus on green energy. On the other hand, most countries like the U.S has an economy that thrives on manufacturing. Several industries around the country manufacture products that greatly contribute to the foreign exchange earnings and also provide employment to many citizens of the U.S. These industries are however a great source of pollution because of the waste products such as chemical wastes and toxic fumes that are let out into the environment.
Power plants also play a big role in industrial pollution and together with the heavy industries they account for nearly 80% of all greenhouse gas emissions. Some states are known to be industrial states and have a number of big and robust industries. Apart from employment that these industries provide to its local people, they also greatly pollute the environment leading to low quality of air and other health complications. States which have fewer industries and manufacturing plants are less polluted and have a lower amount of carbon emission.
Worst Polluters In The United States
The state of Ohio has several manufacturing plants and is one of the states that has a big electricity generation sector. The harmful fumes emitted from the plants and other industries makes the state one of the highest polluted states in the U.S. Ohio is also home to a coal plant which contributes a very large amount of greenhouse emissions into the environment.
utting down on these emissions will mean that Ohio shifts to green energy but that will be a tall order given the significance of these industries to the state and also to the country as a whole. Kentucky has seen its level of pollution rise because the authorities have not been able to find ways of reducing emissions from its coal fired power plants that release a lot of toxic fumes into the environment. Pollution from its electricity sector has continued to rise placing it just behind Ohio in toxic air pollution.
States like Florida have continued to fall down the list of highly polluted states because there has been a deliberate shift from coal to natural gas which is much of a less polluter. There are also states like Michigan which are experiencing a decline in manufacturing and in retrospect experiencing less pollution. By default, they have continued to experience a decline in air pollution and not through a well laid out plan to reduce the same.
Trends In Industrial Air Pollution
Some states in the U.S have continued to experience a gradual decline in industrial air pollution, either through deliberate government policies or by default when manufacturing plants begin to close shop. Shifting to more renewable energy sources has greatly helped some states in cutting carbon emissions while in others where different stakeholders have continued to do nothing, air pollution has continued to rise. It is apparent that through deliberate actions to shift to green energy, air pollution can be reduced as has been the case with Florida. US States Most Affected By Industrial Air Pollution
Cancer: 20 Deadliest States
Cancer is the second leading cause of death in America, taking more than half a million lives each year, according to the American Cancer Society. That’s 1,500 lives lost each day. One in four Americans will succumb to the disease.
But not all states are created equally, according to a new national health survey by the United Health Foundation, American Public Health Association and the Partnership for Prevention.
The study doesn’t explain why some states have more cancer deaths per 100,000 people than others. But if you want to know which are the 25 states that fared the worst, read on. http://www.worldlifeexpectancy.com/cancer-clusters-in-america
Cancer Deaths Per 100,000 People
20. Maryland (19) 197.5
19. Illinois (13) 200.1
18. Michigan (12) 201.1
17. North Carolina (7) 202.6
16. South Carolina (10) 203.5
15. Pennsylvania (5) 203.7
14. Missouri 206.3
13. Delaware (20) 206.7
12. Oklahoma 208.4
11. Indiana (4) 208.4
10. Ohio (1) 210.2
9. Maine 210.4
8. Washington D.C. 211.1
7. Alabama (11) 211.3
6. Arkansas 213.1
5. Tennessee (9) 215.3
4. Mississippi (16) 217.7
3. Louisiana 220.1
2. West Virginia (15) 221.6
1. Kentucky (2) 227.0
The President’s Cancer Panel (the Panel), a three-person, federal advisory committee appointed by the President, was established in 1971 with the passage of the National Cancer Act. The Panel is charged with monitoring the development and execution of the activities of the National Cancer Program. Each year, the Panel holds at least four public meetings to solicit input from a variety of stakeholders and submits an annual report to the President of the United States with recommendations focused on improving the National Cancer Program.
The Panel’s latest report, REDUCING ENVIRONMENTAL. CANCER RISK. What We Can Do Now, was released on May 5, 2010. (Select the link for Annual Report for 2008-2009) https://deainfo.nci.nih.gov/advisory/pcp/annualReports/pcp08-09rpt/PCP_Report_08-09_508.pdf